
News
Western Cape passes 27% more buildings plans in 2022 than in 2021
20 January 2023
Click on the images below to enlarge


Between January and November 2022, the Western Cape passed R34.81 billion worth of building plans, representing an increase of 27% compared to the same period in 2021.
This is according to the latest ‘Selected building statistics of the private sector’ released by Statistics South Africa today.
The reports further shows that the Western Cape continues to lead in the value of building plans passed, putting it ahead of the county’s economic hub, Gauteng. It is even more impressive to note that the Western Cape is responsible for nearly one third of the total value of buildings plans passed in South Africa over this time.
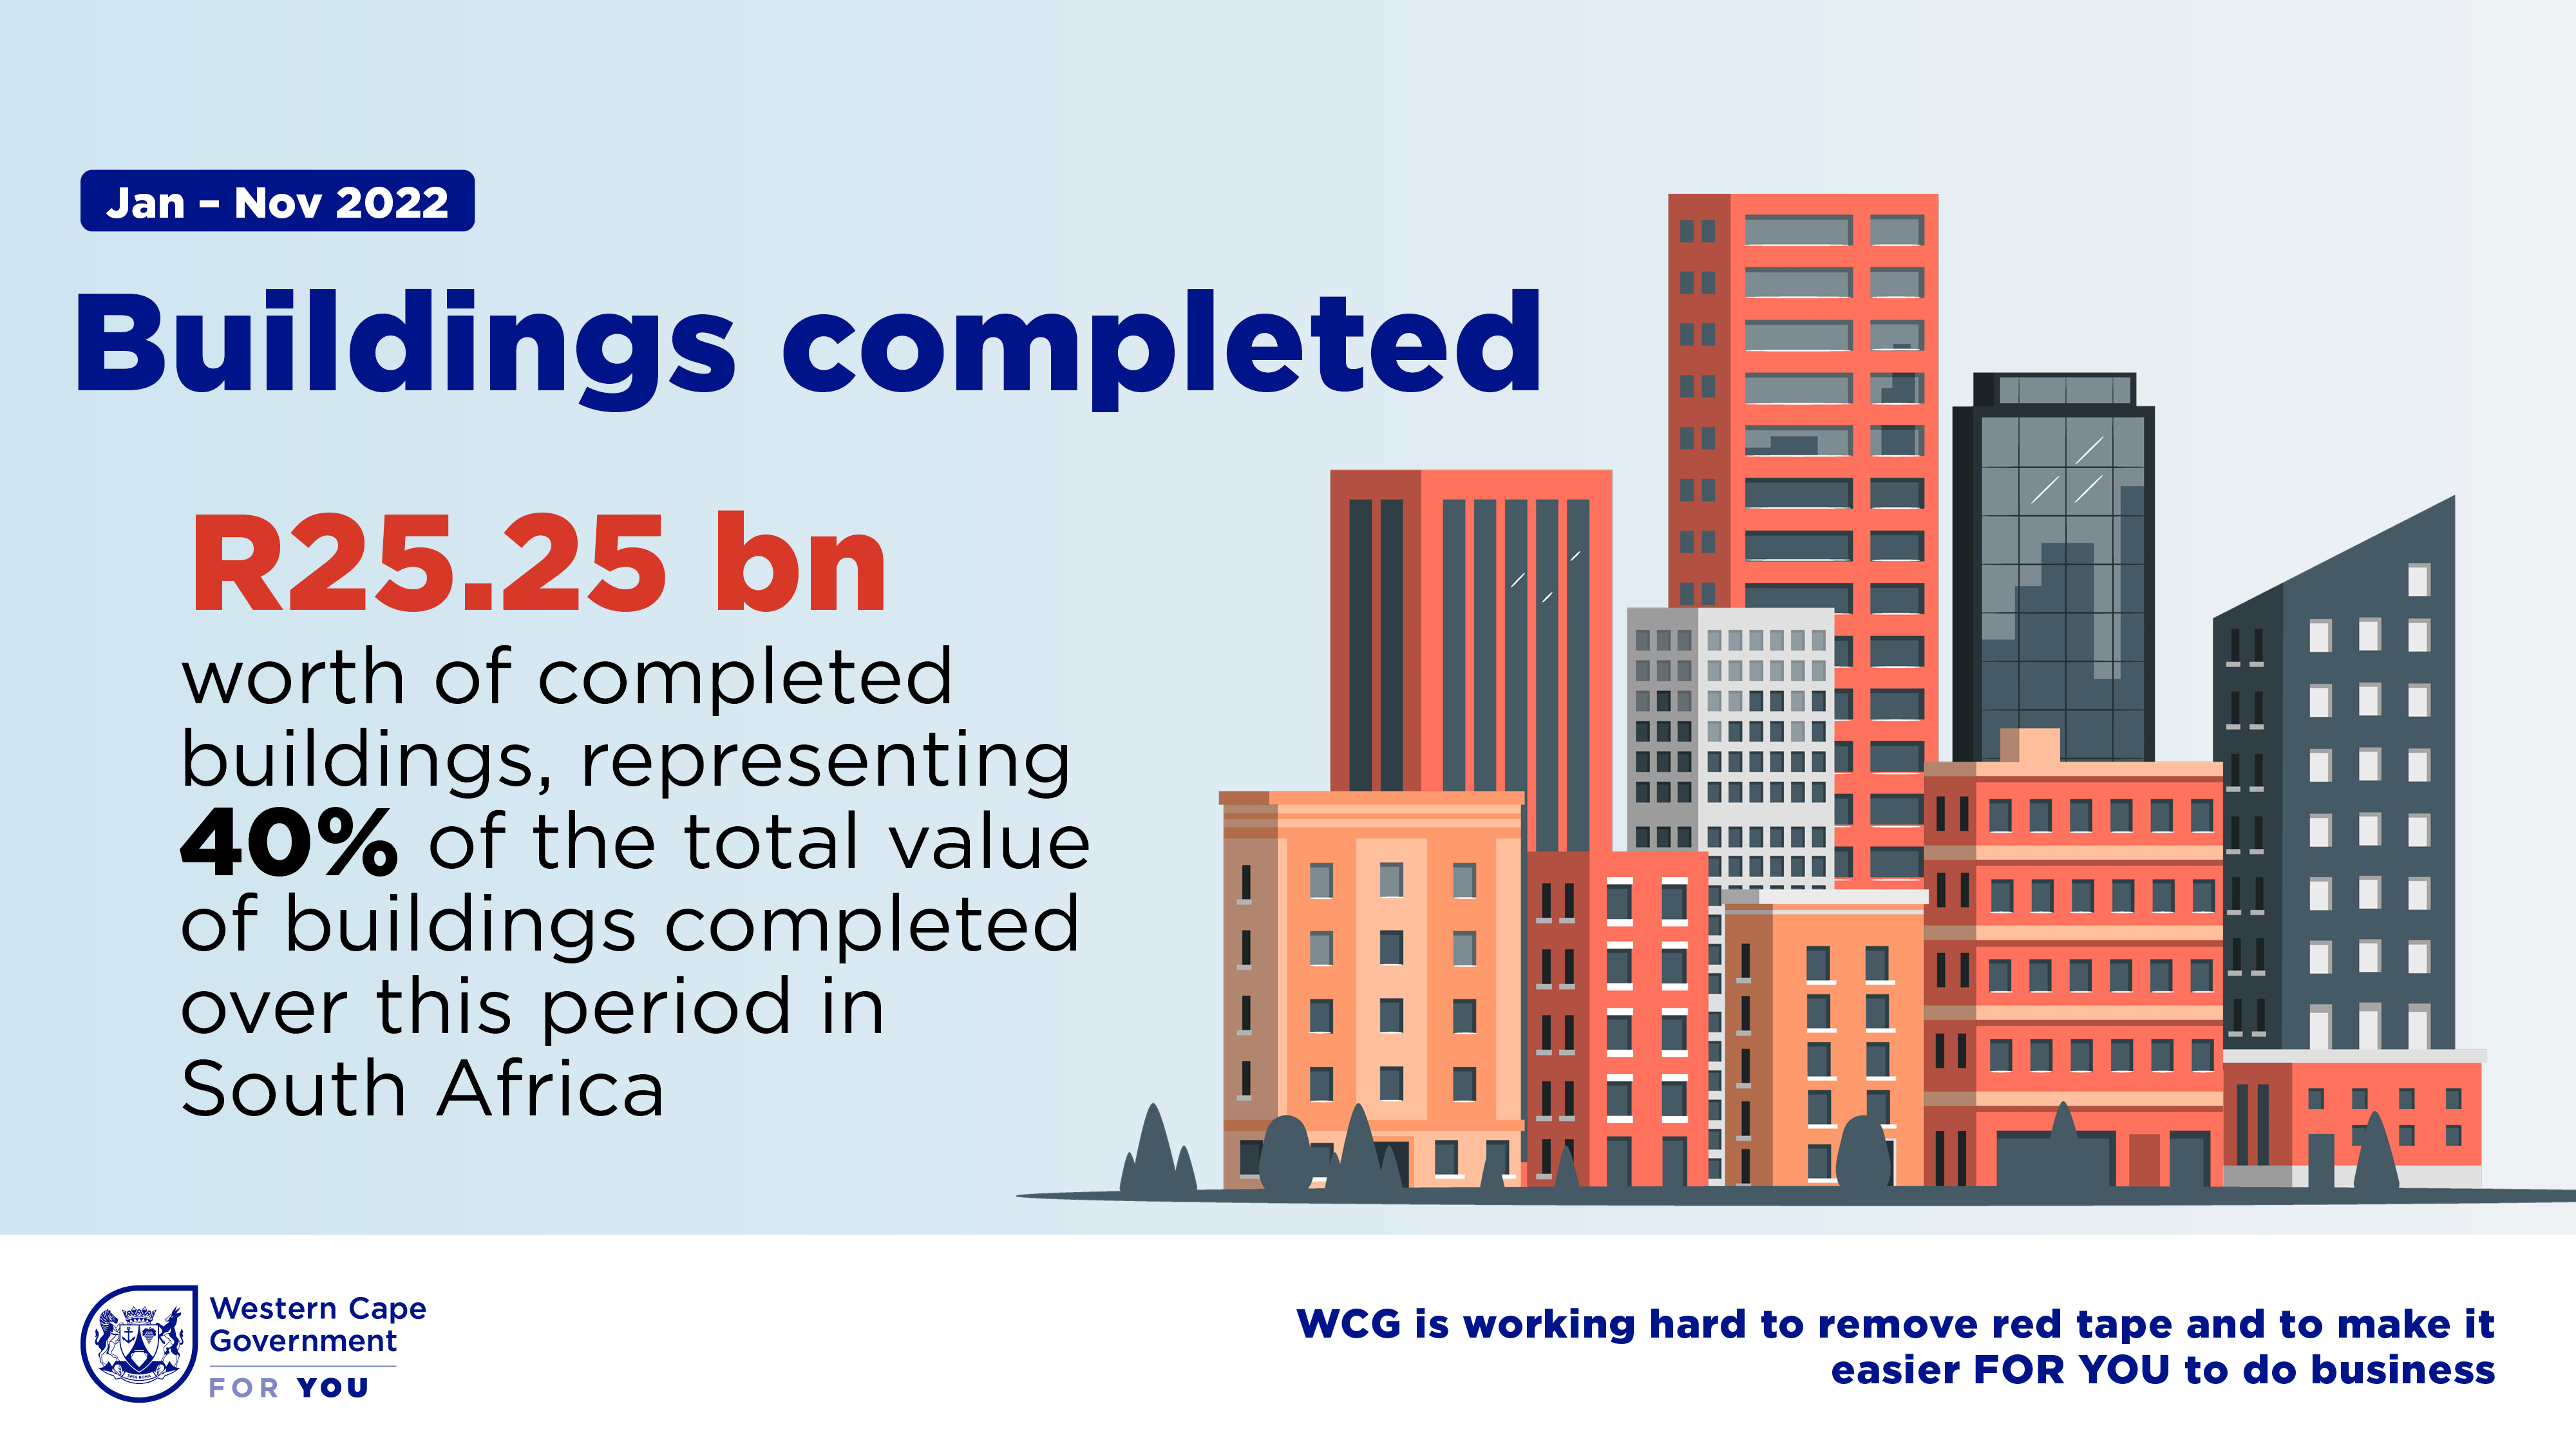
Additionally, the Western Cape continues to lead in the value of buildings completed, which is an important metric for job creation down-the-line, recording R25.25 billion worth of completed buildings between January and November 2022, representing 40% of the total value of buildings completed over this period.
Minister of Finance and Economic Opportunity, Mireille Wenger said: “These impressive statistics speak for themselves, especially considering that building plans passed is a leading economic indicator of confidence in our economy. This news is even more impressive when we consider the impact that loadshedding had on our economy in 2022, with the more than 200 days of rolling blackouts citizens were forced to endure. It also shows us how important it is to enable the private sector so that building plans convert into building sites and create thousands of new jobs in the province.”
|
|
Building Plans Passed Value Jan – Nov 2022 |
% Contribution to the total value of building plans passed Jan – Nov 2022 |
Building Plans Passed % Change between Jan – Nov 2021 and Jan – Nov 2022 |
Buildings Completed Value Jan – Nov 2022 |
% Contribution to the total value of buildings completed Jan – Nov 2022 |
Buildings Completed % Change between Jan – Nov 2021 and Jan – Nov 2022 |
|
Western Cape |
R34,81 billion |
32% |
27.0% |
R25,25 billion |
40.8% |
21.8% |
|
Gauteng |
R33,24 billion |
31% |
-0.30% |
R19,28 billion |
31.2% |
6.0% |
|
KwaZulu-Natal |
R18,26 billion |
17% |
3.80% |
R9,14 billion |
14.8% |
28.5% |
|
Eastern Cape |
R6,88 billion |
6% |
-14.10% |
R2,79 billion |
4.5% |
-7.6% |
|
Mpumalanga |
R4,97 billion |
5% |
40.60% |
R1,11 billion |
1.8% |
3.7% |
|
North West |
R3,79 billion |
4% |
-0.80% |
R2,01 billion |
3.2% |
-11.0% |
|
Limpopo |
R2,59 billion |
2% |
14.60% |
R0.99 billion |
1.6% |
41.9% |
|
Northern Cape |
R1,43 billion |
1% |
45.50% |
R0.72 billion |
1.2% |
21.4% |
|
Free State |
R2,23 billion |
2% |
-5.90% |
R0.54 billion |
0.9% |
-17.9% |
|
South Africa |
R108,25 billion |
100% |
8.10% |
R61,88 billion |
100.0% |
13.8% |
“As a provincial government, we are moving with urgency to ramp up the Western Cape’s energy resilience and to reduce our reliance on Eskom because, if we want this upward construction trend to continue and to contribute to the kind of break-out economic growth we need to create thousands more jobs, we must have a stable and reliable power supply.” Concluded Minister Wenger
Media Enquiries:
Georgina Maree
Spokesperson for the Provincial Minister of Finance and Economic Opportunities
(Responsible for the Provincial Treasury and the Department of Economic Development and Tourism)
Cell: 076 423 7541
|
We are pleased to share with you that the Western Cape Government (WCG) has once again achieved certification as a Top Employer in 2024. |
||||
 |
Western Cape Government © 2023. All rights reserved.
This project is an initiative of the Western Cape Government. |
 |